This case study is not optimized for mobile viewing
Return here via desktop.
Building-X & BAC users
Complex building systems, fragmented roles
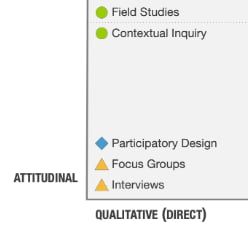
Semi-Structured IDIs + Ethnography
Where operators and onboarders diverge
Quotes, Highlight Reels, Journey Maps
Faster delivery, higher customer confidence
How UX Research Revealed the Structural Causes Behind Delayed Time-to-Delivery
I led a multi-phase exploratory research study to determine whether the problem was one of execution—or one of misunderstanding. Through interviews, ethnographic fieldwork, and contextual inquiry, the research revealed a structural mismatch between how data-onboarders conceptualized system configuration and how operators actually reasoned about live building environments.
Problem
Longer Time-to-Delivery,
Low Customer Satisfaction, Loss of contracts
Sequential exploratory research study (Interviews + Ethnography w/ Contextual Inquiry)
Time-to-delivery ↓ • Customer satisfaction ↑ • Competitive contract wins ↑
Research Intervention
Impact


This insight shifted the organization’s focus away from additional training and dashboard optimization toward contextualized onboarding, nomenclature fidelity, and workflow alignment—reducing escalations, improving delivery confidence, and reshaping how Building-X was deployed across sites.
Siemens’ Building-X platform was experiencing persistent delays in time-to-delivery and declining customer satisfaction, particularly during onboarding and early deployment. While teams attributed these issues to training gaps and incomplete onboarding screens, repeated optimizations failed to improve outcomes.
EXECUTIVE SUMMARY
Delayed time-to-delivery was not caused by insufficient training, dashboards, or tooling, but by structural mismatches between operator workflows, system representations, and onboarding logic. In other words:The organization was optimizing how people used the system, without first understanding how work actually moved in live environments.
Stakeholders and Business Context
Stakeholders
I worked closely with stakeholders across Product Management, Sales, Business Intelligence, Pricing, Packaging, and Product Marketing to understand both their goals and the assumptions guiding current delivery practices.
In addition to ad-hoc encounters, stakeholders were invited to a focus group like experience, framed as an innovation workshop. In preparation for this I conducted an extensive heuristic evaluation of the current experience in order to inform my workshop stimuli.
Whiteboarding activities and round-robbin Q&A informed the research plan's assumptions, which were put into a spreadsheet to parse out into goals and hypotheses in a UXR clinical, where I demoed to junior researchers how to reverse engineer the assumptions. I also learned from the junior researchers (former designers from the product team) also informed additional context of the workshop's artifacts.
Across these groups, several shared beliefs surfaced:
That efficiency was lagging primarily due to onboarding or training deficiencies
That time-to-delivery could be improved by refining dashboards and user documentation/manuals, onboarding coach marks
That existing quantitative metrics sufficiently captured user performance issues
These assumptions shaped product decisions, onboarding workflows, and success metrics—but had not been validated against operators’ real-world practices.
Problem framing and reframing
Operators appeared slow, inconsistent, or underperforming.
Escalations and rework were common.
Leadership defaulted to solutions like:
more training
dashboard UI design system facelift
tighter documentation
But these assumed that:
the system already represented reality adequately
users merely needed to “learn it better”
Research Question:
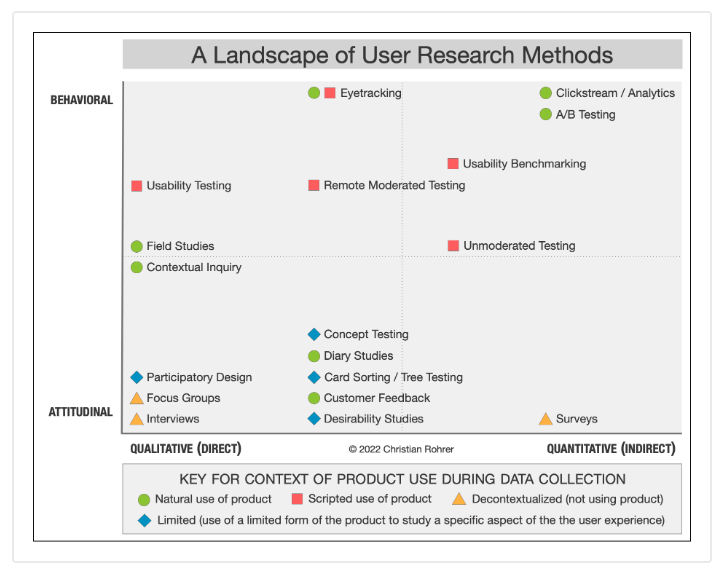
How might differences and similarities in workflows and mental models between operators and data-onboarders, impact KPIs like time-to-delivery and customer satisfaction. The investigation aims to understand the specific ways in which these roles diverge and converge, ultimately providing insights into optimizing processes and enhancing outcomes related to classic KPIs such as time-on-task and customer satisfaction?


MY ROLE: SENIOR UX RESEARCHER
End-to-end execution and delivery of research processes: Stakeholder Elicitation, Research Planning, Execution, Analysis and Innovation Collaboration
Timeline: 6 months
Team: diverse product stakeholders including 3 PMs, 15 designers and 50 engineers
The Risk of Optimizing the Wrong Problem


Wrong organizational Beliefs
Building-X is deployed in live, high-stakes building environments where delayed configuration, incorrect assumptions, or misaligned dashboards can cascade into physical human harm to operators and end-users.
CONTEXT

At the time of this study, internal teams believed that inefficiencies in time-to-delivery were primarily caused by insufficient training, incomplete onboarding materials, or lack of user compliance. As a result, optimization efforts focused on improving documentation, coaching marks, and dashboard affordances.
Risk in acting on those beliefs
However, dashboards and SLAs assumed that operators and data-onboarders shared a common mental model of the system—an assumption that had never been tested and which was supported by out-dated personas and user journeys described in business contracts.
Need for Research
Concurrent & Sequential Exploratory Mixed Method
Multi-Phase Sequential Exploratory Study
I conducted a multi-phase sequential exploratory mixed-methods study designed to surface mental models, workflow dependencies, and environmental constraints that quantitative data could not capture.
Methods & Sampling included:
Phase 1 - Semi-Structured In-Depth-Interview (IDI), n = 15
15 person data-onboarding team specifically for the University of Michigan - Ann Arbor campus Building Automation Controls department. The participants worked and participated remotely from Austin, Texas.
This discussion guide allowed for screen-sharing of workflows if the participant felt it was helpful for explaining their day to day responsibilities.
Phase 2 - Ethnographic Field Study ( n > 50 ) with nested Contextual Inquiry (n = 7)
Siemens customer-beta site (University of Michigan Ann Arbor) where users would be in their natural environment (early phase of data onboarding journey.)
Ad-hoc mini interviewees would consist of anyone working near a station-workspace, this ended up being n = 7. Presence Context: They were already doing a scheduled data onboarding (data migration) visit and they were open to a Voice of the Customer project (camera presence for Q&A across the campus.)
Analysis: This approach allowed findings from interviews to directly inform field observation


Research question: How might workflows and mental models between operators and data-onboarders, converge and diverge in order to impact KPIs like time-to-delivery and customer satisfaction?
Goal: Improve time-to-delivery and customer satisfaction during Building-X onboarding.
Why Quantitative Metrics Couldn’t Answer the Core Question
While Business Intelligence metrics accurately reflected delivery timelines and escalation frequency, they did not explain why delays were occurring. Dashboards showed outcomes—but not cognition, coordination, or constraint.
What was missing was an understanding of how operators and data-onboarders actually reasoned about buildings, systems, and responsibilities in situ.
Choosing Depth Over Breadth
Initially, stakeholders requested interviews only, which would merely give broad verbalizations based on self-reported day to day tasks and generalizations-- and even worse, inaccurate memories. This would actually increase the scope of the research.
Instead, I proposed a larger scope study with more narrow insights scope. By choosing to add ethnographic field work and contextual inquiry, we could analyze the interviews with a sharper lense that would zoom into specific problems in the siemens-customer relationship.
Scoping the Research
Hypothesis Results & Findings
Prior to this study, the prevailing assumption was that time-to-delivery delays were caused by insufficient training, incomplete onboarding, or lack of user effort.
This research showed that assumption was incorrect.
Interviews revealed that data-onboarders were making decisions based on abstractions inherited from sales artifacts, contracts, and spreadsheets—mental models optimized for delivery documentation, not for live building operation. These assumptions shaped dashboard configuration and onboarding workflows in ways that systematically diverged from operators’ day-to-day realities.
Ethnographic fieldwork demonstrated that operators did not conceptualize Building-X as a dashboard-first system. Instead, they relied on spatial reasoning, sensory cues, informal cross-team coordination, and locally meaningful terminology to manage building performance. These cognitive strategies were not supported—or even visible—in existing onboarding materials.
As a result, time-to-delivery lagged not because operators failed to learn the system, but because the system was onboarding users into an incorrect representation of their own work.
This mismatch created downstream effects: delayed releases, repeated escalations, contractual friction, and customer dissatisfaction—none of which could be resolved through additional training alone.

//what we were getting wrong

BAC Operators were actively compensating for representational gaps in sales-built personas.
KEY FINDING


Operators appeared slow or hesitant because the system failed to surface what mattered when it mattered.
KEY FINDING
Onboarding failed because system nomenclature and abstractions didn't match lived workflows.
KEW FINDING
Dashboards hid temporal dependencies critical to safe action.
KEY FINDING
Assets for Actionable Insights
1. Quotes from IDIs and Contextual Inquiry Notes
Quotes highlighted cognitive load, failure points, and non-negotiable workflows.
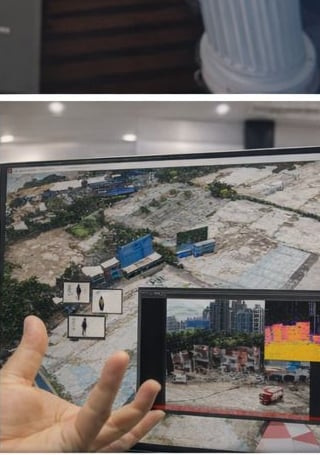
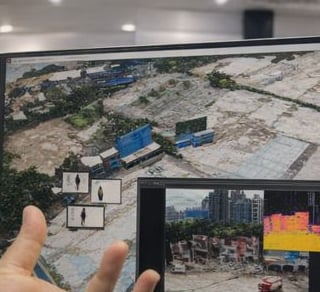
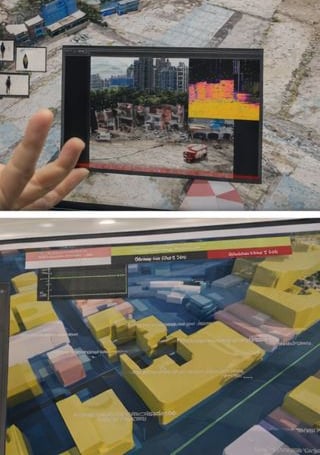
2. Environmental Images
Captured operators in their real workspaces, showing what they looked at, pointed to, ignored, or used simultaneously with Building X. This included screenshots of data-onboarders showing their tool's interfaces.
3. Journey Maps
Spatial Interaction Maps between personas with mapped operator zones, overlapping responsibilities, and campus-level dashboard usage.
4. Highlight Reels of Real-Time Dashboard & Station Use
Annotated reels showing where operators struggled, improvised, or switched to analog tools.
5. 24-Hour Rapid Synthesis
Delivered a clear, prioritized insight package within a day of the last fieldwork day. This served as the initial presentation which summarized the data. Making this was only possible with daily journaling and synthesis-- consecutively building the report as the fieldwork progressed.
// Outputs are not just reports, they are recognition devices.
End-user Interpretative Labor
The images show actions that were taken after conversational comprehension questions. Users correctly identified what the system was showing but then when on to deliberate between multiple- yet plausible- interpretations which would have to be investigated at far away sensors and other distributed campus operators.


Recommendations & Outcomes
1. Shift from “Point Tracking” to contextualized onboarding workflows
Data-onboarders moved from counting points to counting connected to priorities:
Quality of connections included root-cause analysis
Operator-driven workflows that gave contextual naming tied to real-world use
More Personalized, Iterative Data Visualizations
Each release of Building X incorporated increasing fidelity to operator cognition and site uniqueness.
2. Contracts updated to include nomenclature fidelity for faster early delivery of initial releases
Sensor naming conventions were redesigned to match operator terminology and spatial logic. This resulted in:
Faster troubleshooting, fewer escalations, and clearer dashboards.
Cybersecurity improved through custom terminology since customer-specific naming systems reduced the predictability of asset identifiers.
Customers received earlier functional snapshots, with transparency that visualization quality would mature over time.
3. More Frequent On-Site Visits
Data on-boarders increased face time with operators, improving rapport and generating richer insights. Each site visit corresponded with a new upcoming release that was more personalized than the previous.
Additional research was planned through training local data-onboarding teams to conduct regular contextual inquiry at all U.S. sites. UX Research-Stakeholder training was complete 3-months after the initial presentation. Effectively making this research pilot program for iterative VOC visits.


// The BAC experience was updated with better data nomenclature, SLA processes with routine site visits. This created faster time-to-delivery, more customer satisfaction and competitive contract wins.
View another case study
See how UX Research at Instagram helped Creators, or go back to view others in the case study repository.


© 2013-2025 AI-Ethicist.com LLC / AI-Ethicists.org